Day 4: Genome Dereplication & Taxonomic Classification - From MAGs to Species
Day 4: Genome Dereplication & Taxonomic Classification
| Estimated Time: 4-6 hours | Difficulty: Intermediate | Prerequisites: Day 3 (Binning) |
📚 Table of Contents
- Introduction
- What is Genome Dereplication?
- What is GTDB Taxonomy?
- Software Installation
- Workflow Overview
- Step 1: Genome Dereplication with dRep
- Step 2: Taxonomic Classification with GTDB-Tk
- Step 3: Phylogenetic Tree Visualization
- Step 4: Species Representative Selection
- Best Practices
- Troubleshooting
🎯 Introduction
Welcome to Day 4! After recovering high-quality MAGs in Day 3, you likely have many similar genomes. Some might be:
- The same species from different samples
- Closely related strains
- Nearly identical genomes with minor variations
Today’s goals:
- ✅ Dereplicate - Remove redundant genomes, keep best representatives
- ✅ Classify - Assign accurate taxonomic names using GTDB
- ✅ Visualize - Create beautiful phylogenetic trees
- ✅ Curate - Select species representatives for downstream analysis
🔬 What is Genome Dereplication?
Dereplication identifies and removes redundant genomes based on sequence similarity.
Why Dereplicate?
Problem: You recovered 200 MAGs across 10 samples, but:
- 50 might be the same E. coli strain
- 30 could be nearly identical Bacteroides species
- This redundancy inflates your dataset and wastes computational resources
Solution: Dereplication gives you:
- ✅ One representative genome per species
- ✅ Reduced dataset size (often 50-70% reduction)
- ✅ Faster downstream analysis
- ✅ Clearer biological interpretation
How Does dRep Work?
dRep uses a two-step clustering approach:
- Primary clustering (MASH)
- Fast, approximate sequence similarity
- Groups genomes at ~90% ANI threshold
- Creates initial clusters
- Secondary clustering (ANI)
- Precise average nucleotide identity (ANI)
- Default: 95% ANI = same species
- Adjustable for strain-level (99%) or genus-level (85%)
- Scoring & Selection
- Ranks genomes by quality (completeness, contamination, N50)
- Selects best representative per cluster
- Outputs dereplicated genome set
ANI Thresholds Guide
| ANI Threshold | Taxonomic Level | Use Case |
|---|---|---|
| 99% | Same strain | Strain-level analysis |
| 95% | Same species | Standard dereplication |
| 90% | Same genus (approx) | Broad clustering |
| 85% | Family level | Very loose clustering |
🌳 What is GTDB Taxonomy?
GTDB (Genome Taxonomy Database) is the modern, standardized bacterial taxonomy system.
Why GTDB Instead of NCBI?
| Feature | GTDB | NCBI Taxonomy |
|---|---|---|
| Standardization | Consistent, phylogeny-based | Inconsistent, literature-based |
| Genome count | 402,709 genomes | Variable |
| Updates | Regular (every 6 months) | Irregular |
| ANI-based species | Yes (95% ANI) | No |
| Polyphyly | Resolved | Common issues |
GTDB Taxonomy Format
d__Bacteria;p__Bacteroidota;c__Bacteroidia;o__Bacteroidales;f__Bacteroidaceae;g__Bacteroides;s__Bacteroides uniformis
Prefixes:
-
d__= Domain -
p__= Phylum -
c__= Class -
o__= Order -
f__= Family -
g__= Genus -
s__= Species
📦 Software Installation
Create Environment
# Create dRep environment
conda create -n drep python=3.9
conda activate drep
conda install -c bioconda drep

# Create GTDB-Tk environment (separate due to dependencies)
conda create -n gtdbtk python=3.9
conda activate gtdbtk
conda install -c bioconda gtdbtk

# Visualization tools
conda install -c bioconda -c conda-forge \
    ete3 \
    biopython \
    dendropy \
    ggtree \
    phylogram
Download GTDB-Tk Database
⚠️ Large download: ~105 GB
conda activate gtdbtk

# Option 1: Automatic download
download-db.sh

# Option 2: Manual download
wget https://data.gtdb.ecogenomic.org/releases/latest/auxillary_files/gtdbtk_data.tar.gz
tar -xzf gtdbtk_data.tar.gz -C ~/gtdbtk_db/

# Set database location
export GTDBTK_DATA_PATH=~/gtdbtk_db/release207
echo 'export GTDBTK_DATA_PATH=~/gtdbtk_db/release207' >> ~/.bashrc
Verify Installation
# Test dRep
conda activate drep
dRep -h

# Test GTDB-Tk
conda activate gtdbtk
gtdbtk -h
gtdbtk check_install
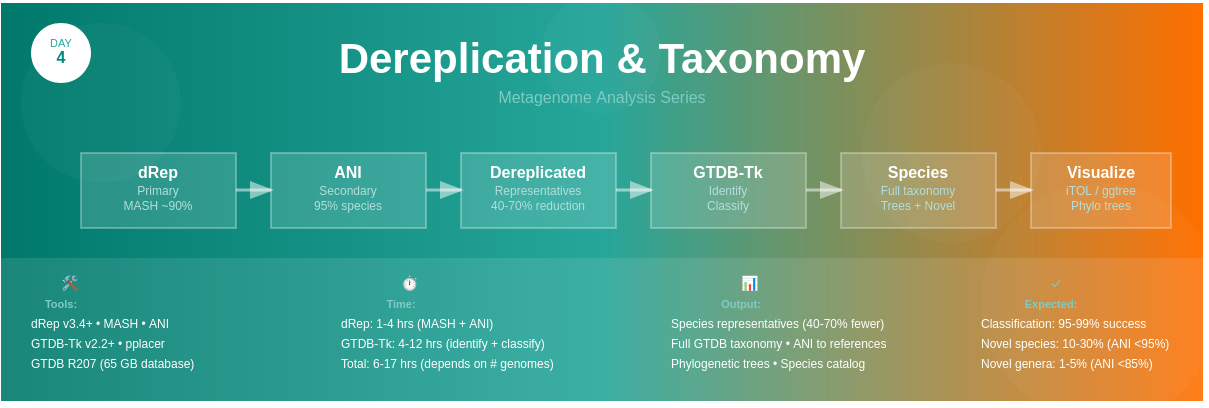
🔄 Workflow Overview
High-Quality MAGs (from Day 3)
            ↓
┌─────────────────────────────────────┐
│ Step 1: dRep Dereplication          │
│ • Primary clustering (MASH)         │
│ • Secondary clustering (ANI 95%)    │
│ • Quality scoring & selection       │
│ • Output: Best representative       │
└─────────────────────────────────────┘
            ↓
Dereplicated MAG Set (50-70% reduction)
            ↓
┌─────────────────────────────────────┐
│ Step 2: GTDB-Tk Classification      │
│ • Phylogenetic placement            │
│ • ANI to reference genomes          │
│ • Taxonomic assignment              │
│ • Output: Full taxonomy             │
└─────────────────────────────────────┘
            ↓
Classified Genomes + Phylogenetic Trees
            ↓
┌─────────────────────────────────────┐
│ Step 3: Tree Visualization          │
│ • iTOL for interactive trees        │
│ • ggtree for publication figures    │
│ • Annotation with metadata          │
└─────────────────────────────────────┘
          ↓
Publication-Ready Trees & Species Catalog
📊 Step 1: Genome Dereplication with dRep
Basic Dereplication
conda activate drep

# Dereplicate genomes at 95% ANI (species level)
dRep dereplicate \
    dereplicated_genomes \
    -g quality_mags/*.fa \
    --ignoreGenomeQuality \
    -comp 50 \
    -con 10 \
    -p 32 \
    -sa 0.95

# Alternative: Use CheckM2 quality scores
dRep dereplicate \
    dereplicated_genomes \
    -g quality_mags/*.fa \
    --genomeInfo checkm2_output/quality_report.tsv \
    -comp 50 \
    -con 10 \
    -p 32 \
    -sa 0.95
Parameters explained:
-
-g: Input genomes (glob pattern or list) -
-comp 50: Minimum completeness 50% -
-con 10: Maximum contamination 10% -
-p 32: Number of threads -
-sa 0.95: Secondary ANI threshold (95% = species) -
--ignoreGenomeQuality: Skip quality checks (if already filtered)
Advanced Dereplication Options
# Strain-level dereplication (99% ANI)
dRep dereplicate \
    dereplicated_strains \
    -g quality_mags/*.fa \
    -comp 70 \
    -con 5 \
    -p 32 \
    -pa 0.99 \
    -sa 0.99 \
    -nc 0.50 \
    --clusterAlg average

# Parameters:
# -pa 0.99: Primary ANI threshold
# -sa 0.99: Secondary ANI threshold
# -nc 0.50: Coverage threshold
# --clusterAlg: Clustering algorithm (average/single/complete)
Understanding dRep Output
dereplicated_genomes/
├── data/
│   ├── Clustering_files/
│   │   ├── Mdb.csv              # MASH distances
│   │   └── Ndb.csv              # ANI distances
│   ├── checkM/
│   │   └── checkM_outfile.tsv   # Quality scores
│   └── MASH_files/
├── data_tables/
│   ├── Cdb.csv                  # Cluster information
│   ├── Sdb.csv                  # Score information
│   ├── Wdb.csv                  # Winner information (selected reps)
│   └── Widb.csv                 # Winner information with details
├── dereplicated_genomes/        # Final dereplicated MAGs
│   ├── genome1.fa
│   ├── genome2.fa
│   └── ...
└── figures/
    ├── Clustering_dendrogram.pdf
    ├── Primary_clustering_dendrogram.pdf
    ├── Secondary_clustering_dendrograms.pdf
    └── Winning_genomes.pdf
Analyze Dereplication Results
# Count original vs dereplicated
original=$(ls quality_mags/*.fa | wc -l)
dereplicated=$(ls dereplicated_genomes/dereplicated_genomes/*.fa | wc -l)

echo "Original genomes: ${original}"
echo "Dereplicated genomes: ${dereplicated}"
echo "Reduction: $(echo "scale=1; (${original}-${dereplicated})/${original}*100" | bc)%"

# View winning genomes
cat dereplicated_genomes/data_tables/Widb.csv | column -t -s,

# View cluster assignments
cat dereplicated_genomes/data_tables/Cdb.csv | column -t -s,
Visualize Dereplication Results
Python script to create dereplication summary: use drep_summary.py from the the github repo 🔗 Day 4 →
🏷️ Step 2: Taxonomic Classification with GTDB-Tk
Classify Dereplicated Genomes
conda activate gtdbtk

# Run GTDB-Tk classify workflow
gtdbtk classify_wf \
    --genome_dir dereplicated_genomes/dereplicated_genomes \
    --out_dir gtdbtk_output \
    --extension fa \
    --cpus 32 \
    --pplacer_cpus 8

# Alternative: Classify only bacteria or archaea
gtdbtk classify_wf \
    --genome_dir dereplicated_genomes/dereplicated_genomes \
    --out_dir gtdbtk_output \
    --extension fa \
    --cpus 32 \
    --domain bacteria  # or archaea
What GTDB-Tk does:
- Identify marker genes (120 for bacteria, 53 for archaea)
- Align markers to reference database
- Place in tree using pplacer
- Calculate ANI to reference genomes
- Assign taxonomy based on phylogenetic placement
Expected time:
- ~10-15 minutes per genome
- 50 genomes ≈ 8-12 hours total
Understanding GTDB-Tk Output
gtdbtk_output/
├── align/                       # Marker gene alignments
├── classify/
│   ├── gtdbtk.bac120.summary.tsv     # Main results (bacteria)
│   ├── gtdbtk.ar53.summary.tsv       # Main results (archaea)
│   ├── gtdbtk.bac120.classify.tree   # Phylogenetic tree
│   └── gtdbtk.bac120.markers_summary.tsv
├── identify/                    # Marker gene identification
└── pplacer/                     # Phylogenetic placement
Key output file: gtdbtk.bac120.summary.tsv
Columns:
-
user_genome: Your genome ID -
classification: Full GTDB taxonomy -
fastani_reference: Closest reference genome -
fastani_ani: ANI to reference (%) -
classification_method: How taxonomy was assigned
Parse GTDB-Tk Results
# View summary
column -t -s$'\t' gtdbtk_output/classify/gtdbtk.bac120.summary.tsv | less -S

# Extract classifications
cut -f1,2 gtdbtk_output/classify/gtdbtk.bac120.summary.tsv > genome_classifications.txt

# Count genomes per phylum
awk -F'\t' 'NR>1 {print $2}' gtdbtk_output/classify/gtdbtk.bac120.summary.tsv | \
    sed 's/.*p__\([^;]*\).*/\1/' | \
    sort | uniq -c | sort -rn
Create Taxonomic Summary
Use gtdbtk_tax_summary.py from the the github repo 🔗 Day 4 →
For Detailed Tutorial
See my complete GTDBTK guide →
🌳 Step 3: Phylogenetic Tree Visualization
Option 1: iTOL (Interactive Tree of Life)
iTOL is a web-based tool for beautiful, interactive phylogenetic trees.
Website: https://itol.embl.de/
Steps:
-
Upload tree file:
# Use GTDB-Tk output tree cp gtdbtk_output/classify/gtdbtk.bac120.classify.tree my_tree.nwk -
Go to iTOL: Upload
my_tree.nwk -
Create annotation files:
#!/usr/bin/env python3
# create_itol_annotations.py

import pandas as pd

# Read GTDB-Tk results
df = pd.read_csv('gtdbtk_output/classify/gtdbtk.bac120.summary.tsv', sep='\t')

# Extract phylum for coloring
df['phylum'] = df['classification'].str.extract(r'p__([^;]+)')

# Create color strip annotation
phyla = df['phylum'].unique()
colors = ['#e74c3c', '#3498db', '#2ecc71', '#f39c12', '#9b59b6',
          '#1abc9c', '#e67e22', '#95a5a6', '#34495e', '#16a085']

phylum_colors = {p: colors[i % len(colors)] for i, p in enumerate(phyla)}

# iTOL color strip format
with open('itol_phylum_colors.txt', 'w') as f:
    f.write("DATASET_COLORSTRIP\n")
    f.write("SEPARATOR TAB\n")
    f.write("DATASET_LABEL\tPhylum\n")
    f.write("COLOR\t#ff0000\n")
    f.write("LEGEND_TITLE\tPhylum\n")
    f.write("LEGEND_SHAPES\t" + "\t".join(["1"]*len(phylum_colors)) + "\n")
    f.write("LEGEND_COLORS\t" + "\t".join(phylum_colors.values()) + "\n")
    f.write("LEGEND_LABELS\t" + "\t".join(phylum_colors.keys()) + "\n")
    f.write("DATA\n")

    for _, row in df.iterrows():
        genome = row['user_genome']
        phylum = row['phylum']
        color = phylum_colors[phylum]
        f.write(f"{genome}\t{color}\t{phylum}\n")

print("✓ Created: itol_phylum_colors.txt")
print("Upload this to iTOL as a dataset annotation")
-
Upload annotation to iTOL - Drag and drop onto your tree
-
Customize and export - Download as PDF, SVG, or PNG
Option 2: ggtree in R
ggtree creates publication-quality phylogenetic trees in R.
#!/usr/bin/env Rscript
# visualize_tree.R

library(ggtree)
library(treeio)
library(ggplot2)
library(dplyr)

# Read tree
tree <- read.tree("gtdbtk_output/classify/gtdbtk.bac120.classify.tree")

# Read GTDB-Tk metadata
metadata <- read.delim("gtdbtk_output/classify/gtdbtk.bac120.summary.tsv",
                       sep = "\t", header = TRUE)

# Extract phylum
metadata$phylum <- gsub(".*;p__([^;]+);.*", "\\1", metadata$classification)

# Create basic tree
p <- ggtree(tree) +
  theme_tree2()

# Add phylum colors
p <- p %<+% metadata +
  geom_tippoint(aes(color = phylum), size = 3) +
  scale_color_brewer(palette = "Set3") +
  theme(legend.position = "right")

# Save
ggsave("phylogenetic_tree.pdf", p, width = 12, height = 10, dpi = 300)
ggsave("phylogenetic_tree.png", p, width = 12, height = 10, dpi = 300)

print("✓ Tree saved: phylogenetic_tree.pdf/png")

# Advanced: Circular tree with genome labels
p2 <- ggtree(tree, layout = "circular") +
  geom_tiplab(aes(color = phylum), size = 2, offset = 0.01) +
  scale_color_brewer(palette = "Set3") +
  theme(legend.position = "bottom")

ggsave("phylogenetic_tree_circular.pdf", p2, width = 14, height = 14, dpi = 300)

# With heatmap of ANI values
p3 <- ggtree(tree) %<+% metadata +
  geom_tippoint(aes(color = fastani_ani), size = 3) +
  scale_color_gradient(low = "blue", high = "red",
                       name = "ANI to\nReference (%)") +
  theme_tree2() +
  theme(legend.position = "right")

ggsave("phylogenetic_tree_ani.pdf", p3, width = 12, height = 10, dpi = 300)
💡 Best Practices
Before Dereplication
- ✅ Filter MAGs by quality (recommend: comp >50%, cont <10%)
- ✅ Use consistent quality metrics (CheckM2 recommended)
- ✅ Check genome file formats (FASTA only)
- ✅ Verify file naming is consistent
During Dereplication
- ✅ Choose appropriate ANI threshold (95% for species, 99% for strains)
- ✅ Use quality scoring if available (
--genomeInfoflag) - ✅ Set reasonable quality thresholds
- ✅ Save all dRep output tables for later analysis
GTDB-Tk Classification
- ✅ Use latest GTDB database (update regularly)
- ✅ Classify dereplicated genomes only (saves time)
- ✅ Keep output trees and metadata
- ✅ Validate novel species with ANI <95%
Tree Visualization
- ✅ Use iTOL for interactive exploration
- ✅ Use ggtree for publication figures
- ✅ Include metadata (phylum, quality, abundance)
- ✅ Save in multiple formats (PDF, SVG, PNG)
🔧 Troubleshooting
dRep Issues
Problem: “No clusters formed”
Solutions:
# Lower ANI threshold
dRep dereplicate out -g *.fa -pa 0.90 -sa 0.90

# Check genome quality
dRep check_dependencies

# Verify MASH installation
which mash
Problem: “Out of memory”
Solutions:
# Reduce threads
dRep dereplicate out -g *.fa -p 8

# Use multiround_primary_clustering
dRep dereplicate out -g *.fa --multiround_primary_clustering

# Process in batches
GTDB-Tk Issues
Problem: “Database not found”
Solutions:
# Set environment variable
export GTDBTK_DATA_PATH=/path/to/gtdbtk_db/release207

# Verify database
gtdbtk check_install

# Re-download if corrupted
download-db.sh
Problem: “Not enough marker genes”
Solutions:
- Genome may be too fragmented (check N50)
- Low completeness (<50% not recommended)
- Wrong domain (trying to classify archaea as bacteria)
# Check domain first
gtdbtk identify --genome_dir genomes/ --out_dir identify_out --extension fa

# Then classify only bacteria or archaea
gtdbtk classify_wf --genome_dir genomes/ --out_dir out --domain bacteria
Problem: “pplacer memory error”
Solutions:
# Reduce pplacer threads
gtdbtk classify_wf ... --pplacer_cpus 1

# Use scratch directory
gtdbtk classify_wf ... --scratch_dir /tmp/gtdbtk

# Process in smaller batches
📈 Expected Results
Typical Dereplication Rates
| Initial MAGs | Dereplicated | Reduction |
|---|---|---|
| 100 | 40-60 | 40-60% |
| 200 | 70-120 | 40-65% |
| 500 | 150-300 | 40-70% |
Factors affecting reduction:
- Number of samples (more = more redundancy)
- Sample similarity (related samples = more redundancy)
- Community diversity
GTDB-Tk Classification Success
Expected outcomes:
- 95-99% of quality MAGs successfully classified
- 10-30% may be novel species (ANI <95%)
- 1-5% may be novel genera (ANI <85%)
✅ Success Checklist
Before moving to Day 5:
- Genomes dereplicated at appropriate ANI threshold
- Reduction rate documented (typically 40-70%)
- All dereplicated genomes classified with GTDB-Tk
- Taxonomic catalog created
- Phylogenetic trees generated and visualized
- Species representatives organized
- Novel species identified and documented
📚 Key Papers & Resources
Essential Reading
- dRep:
- Olm et al. (2017) - Nature Biotechnology
- dRep: a tool for fast and accurate genomic comparisons
- GTDB-Tk:
- Chaumeil et al. (2019) - Bioinformatics
- GTDB-Tk: a toolkit to classify genomes with GTDB
- GTDB Taxonomy:
- Parks et al. (2020) - Nature Biotechnology
- A complete domain-to-species taxonomy for Bacteria and Archaea
- Tree Visualization:
- Yu et al. (2017) - Molecular Biology and Evolution
- ggtree: visualization and annotation of phylogenetic trees
Helpful Links
➡️ What’s Next?
Day 5: Functional Annotation (Coming Soon)
Learn to annotate genes and predict metabolic functions!
Topics:
- Gene prediction with Prodigal
- Functional annotation with eggNOG-mapper
- Pathway reconstruction with KEGG
- Biosynthetic gene cluster identification with antiSMASH
💬 Feedback
Found this helpful? Have suggestions?
Repo for today’s code and other details
🔗 Day 4 →
Last updated: February 2026