Genome Coverage — What It Is, Why It Matters, and How to Calculate It for NCBI Submission
Genome coverage — what it is, why it matters, and how to calculate it
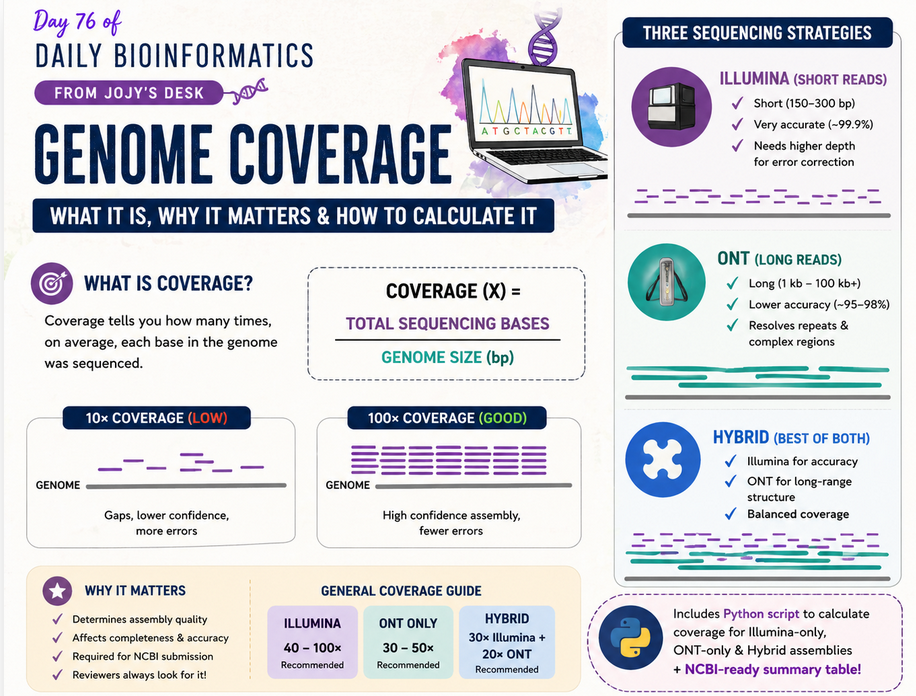
🧬 𝐷𝑎𝑦 76 𝑜𝑓 𝐷𝑎𝑖𝑙𝑦 𝐵𝑖𝑜𝑖𝑛𝑓𝑜𝑟𝑚𝑎𝑡𝑖𝑐𝑠 𝑓𝑟𝑜𝑚 𝐽𝑜𝑗𝑦’𝑠
You assembled your genome and you are getting ready to submit it to NCBI. The submission form asks for sequencing depth. Your supervisor mentions you need at least 30×. A reviewer comes back asking for coverage statistics.
What exactly is coverage? Where does the number come from? And what do you do when you have both Illumina and ONT reads?
This post answers all of that from the beginning — no assumed knowledge — and ends with a Python script that calculates coverage for all three assembly types and produces a table ready for NCBI submission.
What is genome coverage?
Imagine your genome is a road that is 5 million base pairs long. You sequence it by taking millions of short snapshots of random pieces of that road. Coverage tells you, on average, how many times each position on that road was photographed.
The formula is dead simple:
Coverage (X) = Total sequencing bases / Genome assembly size
That is it. No magic. If you sequenced 500 million bases and your assembled genome is 5 million base pairs, your coverage is 100×.
The × symbol (pronounced “times” or “x”) is the unit. 30× means every base in your genome was covered by 30 reads on average. 100× means 100 reads on average.
A concrete example
Genome size:       4,800,000 bp  (4.8 Mb — typical small bacterium)
Total Illumina bases: 480,000,000 bp  (480 Mb — 2 × 150 bp × 1.6M read pairs)

Coverage = 480,000,000 / 4,800,000 = 100×
Why does coverage matter?
Coverage is not just a number for NCBI. It directly determines the quality and reliability of your assembly.
Low coverage (< 10×): Large gaps. The assembler does not have enough reads to build confident contigs. Many positions will have only one or two reads supporting them — any sequencing error there becomes a permanent mistake in your assembly.
Adequate coverage (20–30×): Sufficient for most Illumina assemblies of simple genomes. This is the practical minimum for a genome you would publish.
Good coverage (50–100×): Most positions covered many times. Random sequencing errors (which occur at a rate of ~0.1% per base in Illumina) are effectively corrected by consensus across many reads. Assembly is confident and complete.
Very high coverage (> 200×): Usually not necessary for assembly quality. Can even cause problems — some assemblers collapse repeated regions when coverage is too high. Useful for detecting heterozygosity or mixed populations.
Why Illumina and ONT are measured the same way but contribute differently
Illumina reads are short (150–300 bp) but extremely accurate (~99.9%). High Illumina coverage gives you precise, error-corrected sequences of small regions.
ONT (Oxford Nanopore) reads are long (thousands to hundreds of thousands of bp) but less accurate individually (~95–98%). Lower ONT coverage can still give good assemblies because long reads span repeat regions and resolve structural complexity that short reads cannot.
A hybrid assembly uses both — Illumina reads for base-level accuracy, ONT reads for long-range structural scaffolding. When calculating hybrid coverage, you add the bases from both technologies.
| Assembly type | Minimum coverage (typical) | Why |
|---|---|---|
| Illumina-only | 40–100× | Short reads need depth to correct errors |
| ONT-only | 30–50× | Long reads resolve structure but need depth for polishing |
| Hybrid | 30× Illumina + 20× ONT | Each technology contributes what the other lacks |
What files do you need?
To calculate coverage you need three pieces of information for each sample:
1. Genome assembly size — the total number of base pairs in your final assembled genome. This comes from your assembler statistics file (e.g., from seqkit stats, assembly-stats, or the assembler’s own report). The relevant column is usually sum_len or total_length.
sample              sum_len
Eco_001.fna         4821340
Bac_002.fna         3987200
Rhizo_003.fna       6123450
2. Total sequencing bases per sample — the sum of all bases in your FASTQ reads. Not the number of reads — the total base count. You get this from tools like seqkit stats or FastQC.
# Generate read statistics with seqkit
seqkit stats -T sample_R1.fastq.gz sample_R2.fastq.gz > illumina_read_stats.tsv
The column you want is sum_len (total bases) not num_seqs (read count).
3. Sequencing technology — which strategy was used for each sample (Illumina-only, ONT-only, or hybrid). This is a simple lookup table you create:
sample    tech
Eco_001   illumina
Bac_002   long-read/ONT
Rhizo_003 hybrid
Calculating coverage: step by step manually
Let’s walk through one example of each type before looking at the Python script.
Illumina-only
Sample: Eco_001
Genome size:     4,821,340 bp
Illumina bases:  587,000,000 bp

Coverage = 587,000,000 / 4,821,340 = 121.8×
ONT-only
Sample: Bac_002
Genome size:     3,987,200 bp
ONT bases:       198,600,000 bp

Coverage = 198,600,000 / 3,987,200 = 49.8×
Hybrid assembly
Sample: Rhizo_003
Genome size:      6,123,450 bp
Illumina bases:   420,000,000 bp
ONT bases:        180,000,000 bp

Coverage = (420,000,000 + 180,000,000) / 6,123,450 = 97.9×
For hybrid assemblies you add the two base counts because both technologies contributed reads to the assembly. You are asking: across all the reads we fed into the assembler, how many times does that cover the genome?
Python script for batch coverage calculation
When you have dozens of genomes across all three assembly types, doing this by hand is error-prone. Here is a complete Python script that reads your four input files, matches samples by name, applies the correct coverage formula per technology, and outputs a clean TSV ready for NCBI submission.
Input files expected
genome_stats.tsv                 — assembly sizes (columns: file, sum_len)
illumina_read_stats_per_sample.tsv  — Illumina base counts (columns: sample, total_bases)
ont_read_stats_per_sample.tsv       — ONT base counts (columns: sample, total_bases)
sequencing_tech.txt                 — technology per sample (columns: sample, tech)
The script
import os
import pandas as pd
import numpy as np

# ── Input file paths ──
BASE     = "/project/dkarig/ecocoat/NCBI_oct22"
GENOMES  = f"{BASE}/genome_stats.tsv"
ILLUMINA = f"{BASE}/illumina_read_stats_per_sample.tsv"
ONT      = f"{BASE}/ont_read_stats_per_sample.tsv"
TECH     = f"{BASE}/sequencing_tech.txt"
OUT      = f"{BASE}/Genome_Coverage/genome_coverage_summary.tsv"

os.makedirs(f"{BASE}/Genome_Coverage", exist_ok=True)

# ── Load all four files ──
genomes  = pd.read_csv(GENOMES,  sep="\t", dtype=str)
illumina = pd.read_csv(ILLUMINA, sep="\t", dtype=str)
ont      = pd.read_csv(ONT,      sep="\t", dtype=str)
tech     = pd.read_csv(TECH,     sep="\t", dtype=str)

# Normalize column names (lowercase, strip whitespace)
for df in [genomes, illumina, ont, tech]:
    df.columns = [c.strip().lower() for c in df.columns]

# Convert numeric columns
genomes["sum_len"] = pd.to_numeric(genomes["sum_len"], errors="coerce").fillna(0)

illumina["total_bases"] = pd.to_numeric(
    illumina.get("total_bases", illumina.get("sum_len", 0)),
    errors="coerce"
).fillna(0)

ont["total_bases"] = pd.to_numeric(
    ont.get("total_bases", ont.get("sum_len", 0)),
    errors="coerce"
).fillna(0)

# ── Extract clean sample names from genome file paths ──
def extract_sample(s):
    """
    Strips path, extension, and returns the first two
    underscore-separated parts of the filename as the sample ID.
    Example: /path/to/Eco_001.fna  →  Eco_001
    """
    s = str(s)
    s = os.path.basename(s)
    for ext in [".fa", ".fna", ".fasta", ".fastq.gz", ".fq.gz"]:
        s = s.replace(ext, "")
    return "_".join(s.split("_")[:2]) if "_" in s else s

genomes["sample"]  = genomes["file"].apply(extract_sample)
illumina["sample"] = illumina["sample"].apply(lambda x: str(x).split("/")[-1])
ont["sample"]      = ont["sample"].apply(lambda x: str(x).split("/")[-1])
tech["sample"]     = tech["sample"].astype(str)

# ── Aggregate base counts per sample (in case of multiple FASTQ lanes) ──
illumina_sum = illumina.groupby("sample", as_index=False)["total_bases"].sum()
illumina_sum.rename(columns={"total_bases": "IlluminaBases_bp"}, inplace=True)

ont_sum = ont.groupby("sample", as_index=False)["total_bases"].sum()
ont_sum.rename(columns={"total_bases": "ONTBases_bp"}, inplace=True)

# ── Merge all data on sample ID ──
df = genomes[["sample", "sum_len"]].rename(columns={"sum_len": "GenomeSize_bp"})
df = df.merge(illumina_sum, on="sample", how="left")
df = df.merge(ont_sum,      on="sample", how="left")
df = df.merge(tech,         on="sample", how="left")

df = df.fillna(0)
df["IlluminaBases_bp"] = df["IlluminaBases_bp"].astype(float)
df["ONTBases_bp"]      = df["ONTBases_bp"].astype(float)
df["GenomeSize_bp"]    = df["GenomeSize_bp"].astype(float)

# ── Calculate coverage based on technology ──
def calculate_coverage(row):
    g = row["GenomeSize_bp"]
    if g == 0:
        return np.nan                         # no assembly size → skip
    t = str(row["tech"]).lower()
    if t.startswith("illumina"):
        return row["IlluminaBases_bp"] / g    # Illumina only
    elif t.startswith("hybrid"):
        return (row["IlluminaBases_bp"] + row["ONTBases_bp"]) / g  # both
    elif t.startswith("long") or t.startswith("ont"):
        return row["ONTBases_bp"] / g         # ONT only
    else:
        return np.nan                         # unknown tech

df["CoverageX"] = df.apply(calculate_coverage, axis=1)

# ── Flag samples with missing coverage data ──
missing = df[
    (df["CoverageX"].isna()) |
    ((df["IlluminaBases_bp"] == 0) & (df["ONTBases_bp"] == 0))
]
if not missing.empty:
    missing.to_csv(
        f"{BASE}/Genome_Coverage/missing_samples.tsv",
        sep="\t", index=False
    )
    print(f"⚠️  {len(missing)} samples missing coverage data → missing_samples.tsv")

# ── Save final table ──
df.to_csv(OUT, sep="\t", index=False)
print(f"✅ Coverage summary saved: {OUT}")
print("\nFirst 10 rows:")
print(df[["sample","GenomeSize_bp","IlluminaBases_bp","ONTBases_bp","tech","CoverageX"]].head(10).to_string(index=False))
What each section does
Column normalization: QIIME 2 and genomics tools produce headers with inconsistent capitalisation and spacing. Lowercasing everything and stripping whitespace prevents silent merge failures where Sample ≠ sample.
Sample name extraction: Genome files are usually named like /path/to/Eco_001.fna. The extract_sample function strips the path, removes the file extension, and returns Eco_001. This must match exactly what is in your read statistics files — if your FASTQ files use a different naming convention, edit this function.
Left merge: All merges use how="left", keeping every genome in the assembly file as a row even if read stats are missing. Missing samples go to missing_samples.tsv rather than silently disappearing.
Coverage logic: Three branches based on the tech column. The match is case-insensitive and checks the start of the string, so Illumina, illumina, and ILLUMINA-only all match.
Output table
sample     GenomeSize_bp  IlluminaBases_bp  ONTBases_bp  tech      CoverageX
Eco_001     4821340        587000000         0            illumina  121.77
Bac_002     3987200        0                 198600000    long-read  49.81
Rhizo_003   6123450        420000000         180000000   hybrid     97.94
Common problems and how to fix them
Sample names do not match across files
This is the most common failure. Your genome file might be Eco_001.fna but your read stats file might have eco_001 or Eco-001. The script normalises paths and extensions but not dashes vs underscores or case differences in the sample name itself. Check your naming convention and make it consistent before running.
# Quick check: print unique sample names from each file
cut -f1 illumina_read_stats_per_sample.tsv | sort | uniq
cut -f1 sequencing_tech.txt | sort | uniq
CoverageX comes out as NaN for some samples
Check missing_samples.tsv. The most common causes are: the tech column value does not match any of the three expected strings (illumina, hybrid, long-read), or the base count is genuinely zero (the FASTQ file was empty or the stats tool failed on that sample).
Coverage seems unrealistically low (e.g. 2×)
Usually means the base count is being read from the wrong column. The script looks for total_bases — if your seqkit stats output uses a different column name like sum_len, update the column name in the illumina["total_bases"] line.
Hybrid samples show coverage from only one technology
Means one of the read stats files has zero for that sample. Check whether the sample appears in both illumina_read_stats_per_sample.tsv and ont_read_stats_per_sample.tsv.
Generating the read statistics input files
If you do not already have illumina_read_stats_per_sample.tsv and ont_read_stats_per_sample.tsv, here is how to generate them with seqkit:
# For Illumina paired-end reads (run for all samples)
for sample_dir in /path/to/illumina/reads/*/; do
    sample=$(basename "$sample_dir")
    seqkit stats -T "${sample_dir}"*R1*.fastq.gz \
                    "${sample_dir}"*R2*.fastq.gz \
    | tail -n +2 \
    | awk -v s="$sample" '{print s"\t"$5}' >> illumina_read_stats_per_sample.tsv
done

# For ONT reads
for fq in /path/to/ont/reads/*.fastq.gz; do
    sample=$(basename "$fq" .fastq.gz)
    seqkit stats -T "$fq" \
    | tail -n +2 \
    | awk -v s="$sample" '{print s"\t"$5}' >> ont_read_stats_per_sample.tsv
done
Column 5 ($5) in seqkit stats -T output is sum_len — the total base count. Add a header manually:
sed -i '1s/^/sample\ttotal_bases\n/' illumina_read_stats_per_sample.tsv
sed -i '1s/^/sample\ttotal_bases\n/' ont_read_stats_per_sample.tsv
What to write in your methods section and NCBI submission
NCBI asks for coverage during genome submission as part of the biosample/genome metadata. You can fill it in directly from the CoverageX column — round to one decimal place.
Methods sentence you can copy:
Genome coverage was estimated as the ratio of total sequencing bases to final assembly size. For Illumina-only assemblies, coverage was calculated using total paired-end Illumina bases. For ONT-only assemblies, coverage was calculated using total nanopore bases. For hybrid assemblies, coverage was calculated using the combined total of Illumina and ONT bases. Read statistics were generated with seqkit stats.
Summary
Coverage is a single number — total sequencing bases divided by genome size — but it tells you immediately whether your assembly has enough read support to be reliable. 30× is the practical floor for publication. 50–100× is comfortable. The formula changes slightly depending on whether you used Illumina only, ONT only, or both.
The Python script above handles all three cases, flags missing data, and produces a clean TSV you can copy straight into your NCBI submission form.
Tools used: seqkit (read statistics), pandas + numpy (Python table manipulation). Assembly statistics can also be generated with assembly-stats or seqkit stats on the assembled FASTA.