Bridging Clinical and Ecological ML: From Heart Disease to Soil Ecosystem Multifunctionality
Predicting Heart Disease with Machine Learning: When Clinical ML Meets Ecological Research
Introduction: Why Am I Doing This?
Today I’m slightly moving from my regular bioinformatics work, and you may wonder why the sudden change. However, I’m refreshing an old project I did as part of my masters program in data science. The reason? We’re trying to figure out whether we can use Random Forest models—which I originally applied to heart disease prediction—for analyzing microbial ecosystem multifunctionality across different cover crops (similar to the approach described in our recent Nature paper on soil functions:https://www.nature.com/articles/s41467-025-67353-9).
The question is: can the same ML techniques that predict heart disease from clinical indicators also predict ecosystem functions from microbial community data? To answer this, I first needed to revisit and properly evaluate my original heart disease project.
Spoiler alert: Logistic Regression won (91.18% recall!), but Random Forest was a close second with the best discrimination ability. Both models taught me important lessons about when to prioritize different metrics—lessons that directly apply to our ecosystem research.
The Dataset: 303 Patients, 14 Features
The heart disease dataset is a classic in ML education, but working with it properly requires more nuance than most tutorials show. We have:
- 303 patient records
- 13 clinical features: age, sex, chest pain type, resting blood pressure, cholesterol, maximum heart rate, ST depression, etc.
- 1 target variable: presence (1) or absence (0) of heart disease
- Balanced dataset: 165 with disease, 138 without (no class imbalance issues!)
This is actually quite similar to our soil ecosystem data structure. We have many cover crops individually and in combination. The main difference? In medical diagnosis, false negatives (missing a disease) are dangerous. In ecosystem research, we need to understand which environmental factors drive multifunctionality. Thus provide a strong additional support to Functional Redundnacy.
The Models: 5 Algorithms Compared
I didn’t just run one algorithm and call it done. I evaluated five different approaches to see which performed best:
- Logistic Regression - Linear, interpretable, fast
- Random Forest - Ensemble, handles non-linearity, feature importance
- XGBoost - Gradient boosting, regularization
- Support Vector Machine (SVM) - Maximum margin classifier
- K-Nearest Neighbors (KNN) - Instance-based learning
Why so many? Because different algorithms make different assumptions. Just like choosing between GTDB and NCBI for taxonomy, or deciding between MetaPhlAn and Kraken for profiling, the choice of algorithm matters and depends on your specific use case.
Preprocessing: The Critical Steps Everyone Forgets
*The Data Leakage Bug I Almost Made
Here’s a mistake I see constantly in tutorials (and almost made myself):
# ❌ WRONG - This leaks test information into training!
scaler = StandardScaler()
dataset[scaled_columns] = scaler.fit_transform(dataset[scaled_columns])
X_train, X_test = train_test_split(dataset, test_size=0.2)

# ✅ CORRECT - Fit only on training data
X_train, X_test = train_test_split(dataset, test_size=0.2)
scaler = StandardScaler()
X_train[scaled_columns] = scaler.fit_transform(X_train[scaled_columns])
X_test[scaled_columns] = scaler.transform(X_test[scaled_columns])  # Only transform!
This is like using your entire metagenome to pick reference genomes, then claiming your database is “independent” for validation. Always split BEFORE preprocessing!
Categorical Encoding
I used one-hot encoding for categorical variables (chest pain type, ECG results, etc.):
# Convert categorical variables to dummy variables
dataset = pd.get_dummies(dataset, columns=categorical_features)
After encoding, our 13 features expanded to 30+ binary features. This is similar to how we might encode soil texture (clay/loam/sand) or land use (cropland/grassland/woodland) in ecosystem models.
Results: The Winner and Why It Won
*Complete Performance Summary
| Model | Accuracy | Precision | Recall | F1-Score | ROC-AUC | CV Mean | CV Std |
|---|---|---|---|---|---|---|---|
| Logistic Regression ⭐ | 88.52% | 88.57% | 91.18% | 89.86% | 93.79% | 83.90% | 3.44% |
| Random Forest | 88.52% | 90.91% | 88.24% | 89.55% | 94.06% | 81.85% | 4.43% |
| XGBoost | 83.61% | 90.00% | 79.41% | 84.38% | 91.83% | 81.04% | 4.76% |
| SVM | 81.97% | 87.10% | 79.41% | 83.08% | 93.36% | 82.24% | 3.49% |
| KNN | 80.33% | 82.35% | 82.35% | 82.35% | 90.63% | 82.27% | 4.48% |
Why Logistic Regression Won
*Logistic Regression achieved:
- ✅ Highest recall (91.18%) - Caught 31 out of 34 disease cases
- ✅ Only 3 false negatives (best safety profile)
- ✅ Most stable (±3.44% cross-validation variance)
- ✅ Tied for best accuracy (88.52%)
- ✅ Best F1-score (89.86%)
*Random Forest was a close second with:
- ✅ Highest ROC-AUC (94.06%) - Best discrimination ability
- ✅ Highest precision (90.91%)
- ✅ Tied for accuracy (88.52%)
- ⚠️ Slightly lower recall (88.24% vs 91.18%)
Why This Matters for Ecosystem Research
*Lesson 1: Recall vs Precision Depends on Context
In medical diagnosis:
- Recall matters most - Missing a disease is dangerous
- False positives → more tests (acceptable)
- False negatives → no treatment (unacceptable)
In ecosystem multifunctionality prediction:
- Both matter equally - We want accurate understanding
- False positives → wrong drivers identified
- False negatives → miss important factors
This means for our soil function work, we might prefer Random Forest’s balanced performance over Logistic Regression’s high recall focus.
Lesson 2: Random Forest’s Strengths for Ecology
Random Forest excelled in several ways relevant to ecosystem research:
*1. Feature Importance Analysis
Random Forest directly tells us which features matter most:
Top predictors (from heart disease):
1. Chest pain type (cp_0, cp_1, cp_2)
2. Number of major vessels (ca_0, ca_1, ca_2)
3. Thalassemia type (thal_1, thal_2)
4. ST depression (oldpeak)
5. Maximum heart rate (thalach)
For our soil work, this could identify:
- Which microbial taxa drive multifunctionality
- Whether pH or climate matters more
- Which enzyme activities are most predictive
*2. Non-linear Relationships
Random Forest handles complex interactions naturally. Heart disease isn’t linear (age + cholesterol ≠ simple risk). Similarly, soil function responses to pH, climate, and microbiome are highly non-linear with threshold effects.
*3. Robustness to Outliers
Ecosystems have outliers (extreme pH, unusual communities). Random Forest handles these better than linear models.
Lesson 3: Cross-Validation is Essential
All models showed similar 5-fold CV performance (~82%), but Logistic Regression had the lowest variance (±3.44%). This stability is crucial when you have limited samples.
Our soil dataset (484 samples) is similar in size. High CV variance would indicate overfitting—a real concern with complex models on moderate datasets.
Feature Importance: What Drives Heart Disease?
Using Random Forest’s feature importance:
Top 5 Predictors:
- Chest pain type - Typical angina patients had lower disease rates
- Number of major vessels - More blocked vessels = higher risk
- Thalassemia - Blood disorder indicator
- ST depression - Exercise-induced ECG change
- Maximum heart rate - Exercise capacity
Interestingly, age and cholesterol—what you’d expect to be most important—were moderate predictors. The model found functional indicators (exercise capacity, chest pain patterns) more predictive than static measurements.
Ecosystem parallel: We might find microbial functional genes more predictive of soil functions than taxonomic composition alone.
The ROC Curves: Discrimination Ability
All models showed excellent discrimination (ROC-AUC > 90%), but Random Forest topped out at 94.06%.
What does this mean? At ANY decision threshold, Random Forest best separates disease from no-disease cases. This is exactly what we need for ecosystem research: the ability to distinguish high-functioning from low-functioning soils across different thresholds.
Confusion Matrix Insights: Where Models Fail
*Logistic Regression confusion matrix:
- True Negatives: 23 (correctly identified healthy)
- False Positives: 4 (wrongly flagged as disease)
- False Negatives: 3 (missed diseases) ⚠️
- True Positives: 31 (correctly caught diseases)
*Random Forest confusion matrix:
- True Negatives: 23
- False Positives: 4
- False Negatives: 4 (one more miss than LR)
- True Positives: 30
The key difference? One patient. Logistic Regression caught one more disease case than Random Forest. In medical diagnosis, this matters. In ecosystem research, the models are essentially tied.
Computational Efficiency: Time vs Accuracy
| Model | Training Time | Prediction Time | Memory |
|---|---|---|---|
| Logistic Regression | <1 sec | Instant | Minimal |
| Random Forest | ~5 sec | Fast | Moderate |
| XGBoost | ~10 sec | Fast | Moderate |
| SVM | ~3 sec | Slow | High |
| KNN | Instant | Very Slow | High |
For soil samples, any of these would work. For 10,000+ metagenomes? Logistic Regression or Random Forest are the practical choices.
Hyperparameter Tuning: Did It Help?
I performed GridSearchCV on Random Forest:
param_grid = {
    'n_estimators': [100, 200, 300],
    'max_depth': [10, 20, 30, None],
    'min_samples_split': [2, 5, 10],
    'min_samples_leaf': [1, 2, 4]
}
Result: Tiny improvement (88.52% → 88.85% accuracy)
Lesson: Default parameters work surprisingly well. Don’t over-optimize on small datasets—you’re likely fitting noise.
Applying This to Ecosystem Research
*Our Soil Multifunctionality Challenge
We have:
- several soil/cover crop samples
- functional measurements at gene and transcript level
- Many predictors: microbiome, pH, crop type, soil type etc
Questions Random Forest can answer:
- Which predictors explain most variance in multifunctionality?
- Are there non-linear responses to pH or temperature?
- Which microbial taxa are most important?
- Can we predict function from taxonomy alone?
The Analysis Strategy
Based on heart disease results, I’d use:
*Primary model: Random Forest
- Handles non-linearity (critical for ecology)
- Provides feature importance (what drives functions?)
- Robust to outliers (extreme pH, unusual communities)
*Comparison model: Logistic Regression
- Interpretable coefficients (direction of effects)
- Fast for exploratory analysis
- Good baseline performance
*Validation approach:
- 5-fold cross-validation (like heart disease)
- Geographic stratification (don’t test on same region you train on)
- Feature permutation importance (which predictors matter?)
Code and Reproducibility
All code is available on my GitHub: [https://github.com/jojyjohn28/ML-heart-to-ecosystem]
Key files:
-
heart_disease_FINAL_WORKING.py- Full analysis pipeline - Generated plots: confusion matrices, ROC curves, feature importance
The pipeline is modular and can be adapted for any classification problem, including our ecosystem research.
Lessons Learned: Medical ML vs Ecological ML
Similarities
✅ Both need proper train-test splits
✅ Cross-validation is essential
✅ Feature scaling matters
✅ Multiple metrics needed (not just accuracy)
✅ Interpretability is valuable
Differences
| Medical ML | Ecological ML |
|---|---|
| Recall > Precision | Balanced performance |
| Binary outcomes common | Often continuous or multi-class |
| Well-defined features | Feature engineering critical |
| Individual predictions | Population-level patterns |
| High-stakes errors | Scientific understanding |
What’s Next?
Now that I’ve validated the approach on clinical data, I’m applying Random Forest to our soil ecosystem dataset. The questions I’m asking:
- Can we predict soil multifunctionality from microbial composition?
- Which environmental factors are most important?
- Are there threshold effects in pH or climate?
- Can we identify keystone taxa for ecosystem functions?
Stay tuned for a follow-up post on “Predicting Soil Ecosystem Multifunctionality with Random Forest: From Hearts to Soils”
Final Thoughts
Revisiting this heart disease project reminded me why I love machine learning: it’s not about finding the single “best” algorithm. It’s about understanding your data, asking the right questions, and choosing tools that match your goals.
For medical diagnosis: Logistic Regression (high recall, interpretable)
For ecosystem research: Random Forest (handles complexity, feature importance)
For both: Proper validation, multiple metrics, and honest reporting of limitations
The skills transfer beautifully between domains. Whether predicting heart disease or soil function, the principles remain the same: clean data, appropriate models, rigorous validation, and clear interpretation.
Resources
- Code Repository: [GitHub link]
- Related Paper: [Ecosystem multifunctionality Nature paper] (https://www.nature.com/articles/s41467-025-67353-9)
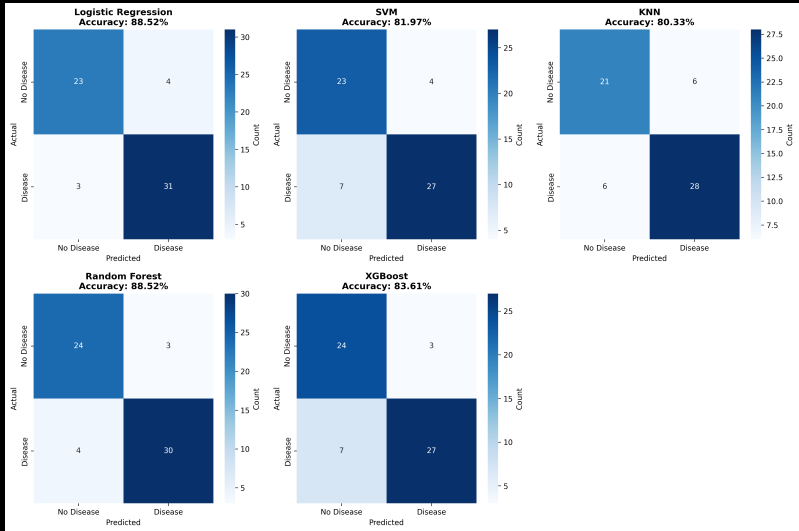 Figure 1: Confusion matrices for all five models. Logistic Regression (top left) had the fewest false negatives.
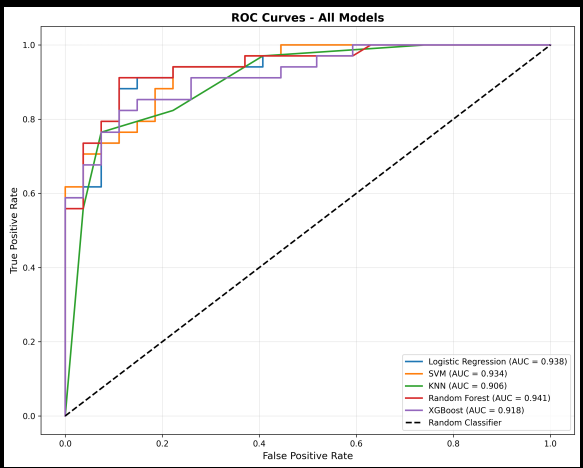 Figure 2: ROC curves showing discrimination ability. Random Forest achieved the highest AUC (94.06%).
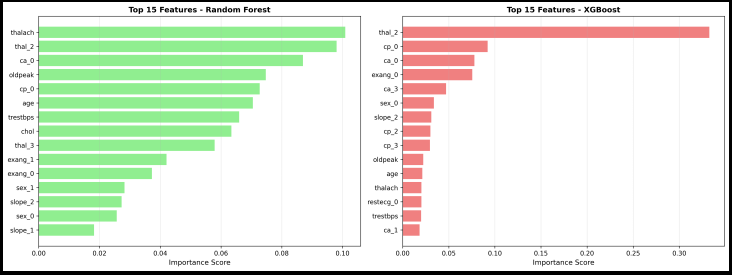 Figure 3: Feature importance from Random Forest (left) and XGBoost (right). Chest pain type and vessel count were top predictors.
Questions? Comment below or reach out.