Amplicon Week — Day 5: Web-based microbiome analysis with easy16S
🌱 Amplicon Week – Day 5
Web-based microbiome analysis with easy16S
Over the past four days of Amplicon Week, we’ve worked through amplicon data analysis using command-line tools (QIIME2), advanced R workflows (Microeco), and functional prediction approaches (PICRUSt2, Tax4Fun2, FAPROTAX).
While these approaches are powerful and flexible, they can feel overwhelming—especially for beginners, students, or collaborators who want to explore their data quickly without writing code.
What is easy16S?
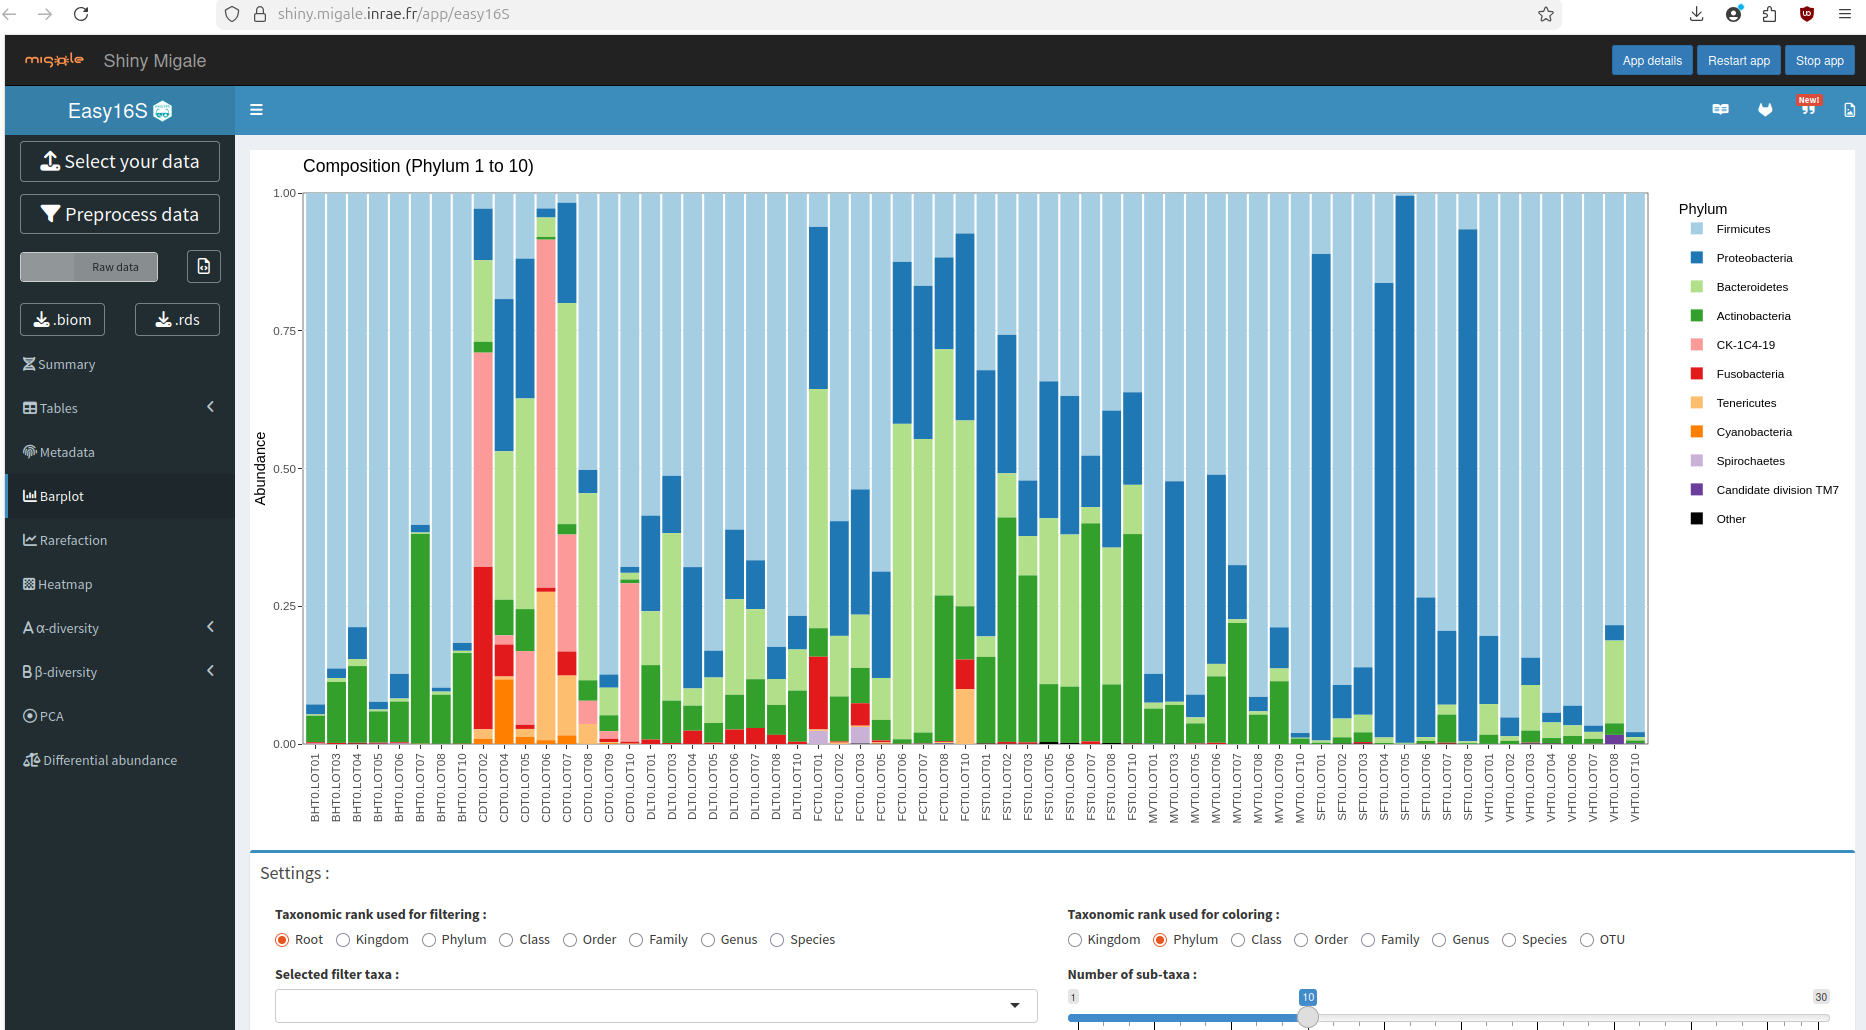
easy16S is a web-based, interactive application designed to facilitate the exploration, visualization, and analysis of microbiome (amplicon) data.
The main goal of easy16S is simplicity: to provide a user-friendly interface with sensible defaults that allows users to perform common microbiome analyses without needing to write scripts or manage complex environments.
👉 Online instance: 🔗 https://shiny.migale.inrae.fr/app/easy16S
No installation required. No command line. Just upload your data and start exploring. For more deatails see: https://easy16s.migale.inrae.fr/
What powers easy16S under the hood?
Although easy16S feels simple on the surface, it is built on robust and widely used microbiome frameworks:
● phyloseq (and its extensions) for data handling and analysis
● FROGS (Find Rapidly OTUs with Galaxy Solution) for sequence processing
● Shiny (R) for interactive web visualization
This makes easy16S a great bridge between point-and-click analysis and more advanced R-based workflows.
What data does easy16S expect?
easy16S is designed primarily for 16S rRNA gene amplicon data and typically works with:
● Feature/OTU/ASV tables
● Taxonomy tables
● Sample metadata
● (Optional) Phylogenetic trees
If you’ve already processed your data using FROGS, integration is seamless. Data from QIIME2 or phyloseq can also be adapted for use in easy16S. If you want to try it, you can use the provided data from DAY3 of https://github.com/jojyjohn28/AmpliconWeek_2025 or you can use the demo data set on easy16S
What can you do with easy16S?
easy16S covers most of the core exploratory analyses used in microbiome studies:
🔹 Community composition
● Taxonomic bar plots (Phylum → Genus)
● Relative abundance summaries
● Interactive filtering and grouping
🔹 Alpha diversity
● Observed richness
● Shannon, Simpson, and related indices
● Group comparisons with basic statistics
🔹 Beta diversity
● Distance matrices (e.g., Bray–Curtis)
● Ordination plots (PCoA)
● Group-based visual comparisons
🔹 Visualization-first exploration
● Interactive plots
● Quick hypothesis generation
● Exportable figures for reports or presentations
All of this can be done without writing a single line of code.
Where does easy16S fit in an amplicon workflow?
easy16S is not a replacement for tools like QIIME2, Microeco, or full R pipelines. Instead, it excels in specific situations:
✅ Teaching and workshops ✅ First-pass data exploration ✅ Rapid visualization for collaborators ✅ Hypothesis generation before deeper analysis
A common and effective strategy is:
QIIME2 / FROGS → easy16S (exploration) → Microeco / R (advanced analysis)
Limitations to keep in mind
● easy16S is primarily focused on 16S data
● Custom statistical modeling is limited compared to R workflows
● Functional prediction is not the main focus (better handled in Day 4 tools)
For complex experimental designs, publication-grade statistics, or multi-omics integration, command-line and R-based approaches remain essential.
Can easy16S be used for other amplicons (18S, ITS, 12S, COI)?
● Yes: easy16S can be used for non-16S amplicons at a basic exploratory level
“Although easy16S is designed for 16S rRNA gene data, it can also be used for other amplicon markers (ITS, 18S, 12S, COI) for basic community composition and diversity analyses. However, functional prediction and some marker-specific interpretations are limited, and 16S remains the primary use case.”