Amplicon Week — Day 4: Functional Prediction from Amplicon Data (PICRUSt2, Tax4Fun2, FAPROTAX)
🌱 Amplicon Week — Day 4
Functional Prediction from Amplicon Data
➡️ This tutorial focuses on 16S rRNA, the most commonly used marker for functional prediction. ➡️ PICRUSt2 can predict functions from 16S, 18S, and ITS, but not from COI or 12S* (because they do not reflect microbial metabolic functions). ➡️ **Tax4Fun2 and FAPROTAX are specifically designed for **bacterial/archaeal** 16S and cannot be applied to COI, 12S, or 18S.
So yes—many amplicon datasets can be used for functional inference, but the tool depends on the marker gene.
PICRUSt2 • Tax4Fun2 • FAPROTAX
Amplicon sequencing reveals who is present — but often we also want to know:
👉 What functions can this microbial community potentially perform? 👉 What metabolic pathways may be active? 👉 How similar or redundant are communities in their functional potential?
Today’s post introduces three major tools used to infer function from 16S/ITS/18S amplicon data:
● PICRUSt2 – KEGG orthologs, EC numbers, pathways
● Tax4Fun2 – KEGG pathways using SILVA-based nearest neighbors
● FAPROTAX – Ecological roles (nitrification, methanogenesis, sulfate reduction, etc.)
⭐These methods do not replace shotgun metagenomics, but they provide meaningful functional hypotheses when only 16S/18S amplicons are available.⭐
1️⃣ Input Files Required for All Functional Tools
You can use the following files generated during day2 or day3 from Qiime2
feature-table.tsv
taxonomy.tsv
dna-sequences.fasta
phylogenetic tree (optional for PICRUSt2)
Required formats: | Tool | Input Files Needed | | ———— | ————————————————————————– | | PICRUSt2 | ASV sequences (dna-sequences.fasta), feature table (feature-table.tsv) | | Tax4Fun2 | Feature table + SILVA taxonomy + representative sequences | | FAPROTAX | Feature table + taxonomy table |
You can find a complete example dataset in the GitHub Day 3 folder. https://github.com/jojyjohn28/AmpliconWeek_2025
2️⃣ PICRUSt2: KEGG-Based Functional Prediction
PICRUSt2 predicts the functional profile of a community by:
-
Placing ASVs into a reference phylogeny
-
Inferring gene families (KOs, ECs)
-
Predicting metabolic pathways
For installation please see installation_and_run.md in the GitHub Day 3 folder. https://github.com/jojyjohn28/AmpliconWeek_2025
🧬 2.1 Run PICRUSt2
picrust2_pipeline.py \
  -s dna-sequences.fasta \
  -i feature-table.tsv \
  -o picrust2_out \
  -p 6
Main outputs: | File | Description | | —————————– | ————————- | | pred_metagenome_unstrat.tsv | KO abundance table | | EC_metagenome_unstrat.tsv | Enzyme commission numbers | | path_abun_unstrat.tsv | KEGG pathway abundances | | marker_pred.tsv | NSTI scores (quality) |
📊 2.2 Basic Visualization in R (ggplot2)
Here is a simple ggplot example for visulization.
library(tidyverse)

ko <- read.table("picrust2_out/KO_metagenome_out/pred_metagenome_unstrat.tsv",
                 sep="\t", header=TRUE, row.names=1, check.names=FALSE)

ko_top20 <- ko %>%
  mutate(KO = rownames(.)) %>%
  pivot_longer(-KO, names_to="Sample", values_to="Abundance") %>%
  group_by(KO) %>%
  summarise(meanA = mean(Abundance)) %>%
  top_n(20, meanA) %>%
  pull(KO)

ko_long <- ko[ko_top20, ] %>%
  mutate(KO = rownames(.)) %>%
  pivot_longer(-KO, names_to="Sample", values_to="Abundance")

ggplot(ko_long, aes(x=KO, y=Abundance, fill=Sample)) +
  geom_col(position="dodge") +
  coord_flip() +
  theme_bw() +
  labs(title="Top 20 KO Functions (PICRUSt2)", x="KEGG Ortholog", y="Predicted Abundance")
3️⃣ Tax4Fun2: KEGG Pathways Based on SILVA
Tax4Fun2 maps 16S ASVs to KEGG using nearest-neighbor matches from SILVA-derived genomes.
It is fast, accurate, and integrates beautifully with Microeco.
🧬 3.1 Run Tax4Fun2 in R
library(Tax4Fun)
library(microeco)

t4f <- trans_func$new(meco_physeq_ra)   # microeco object from Day 3
t4f$for_what <- "prok"

t4f$cal_tax4fun2(
  blast_tool_path = "/path/to/blast/",
  path_to_reference_data = "Tax4Fun2_ReferenceData_v2"
)
Outputs:
● res_tax4fun2_KO – KO table
● res_tax4fun2_pathway – pathway table
● res_tax4fun2_aFRI – absolute functional redundancy
● res_tax4fun2_rFRI – relative functional redundancy
💡 Functional Redundancy
Functional redundancy measures whether multiple taxa share similar functional potential. Tax4Fun2 outputs both aFRI and rFRI, and Microeco can visualize and compare them.
Why it matters:
● High redundancy → resilient, stable communities
● Low redundancy → specialized, vulnerable to disturbance But more genome/MAG based modeliing is needed to consider FRed as proxy to ecosytem functiong or resilience.
🎨 Visualization
All plotting scripts will be included in: https://github.com/jojyjohn28/AmpliconWeek_2025 📁 day4_functional_prediction/tax4fun_plot.R
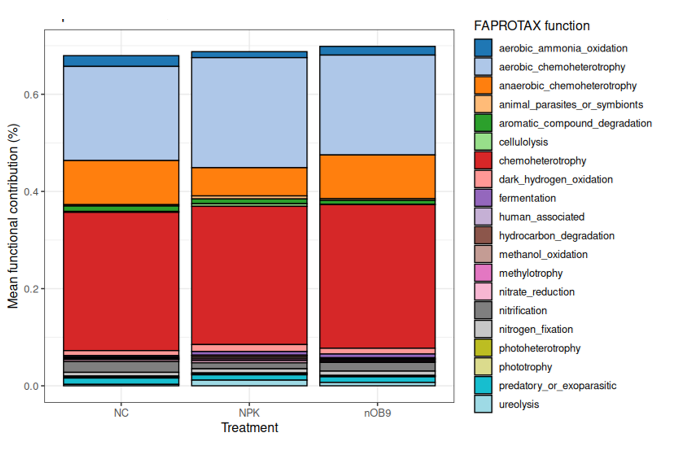
4️⃣ FAPROTAX: Ecological Function Annotation
FAPROTAX is a curated database linking taxa → ecological processes: | Category | Examples | | ———– | ——————————- | | Carbon | methanogenesis, photoautotrophy | | Nitrogen | nitrification, denitrification | | Sulfur | sulfate reduction | | Hydrocarbon | degradation pathways |
It is taxonomy-based, so accuracy depends on classification quality.
🧬 4.1 Running FAPROTAX via Microeco
t_func <- trans_func$new(meco_physeq_ra)
t_func$for_what <- "prok"

t_func$cal_spe_func(prok_database = "FAPROTAX")
t_func$cal_func()            # abundance
t_func$cal_func_FR()         # redundancy
t_func$cal_spe_func_perc()   # percentage
Outputs include:
● Ecological function presence/absence
● Function abundance
● Functional redundancy
🎨 Visualizing FAPROTAX
ggplot scripts will be in: https://github.com/jojyjohn28/AmpliconWeek_2025 📁 day4_functional_prediction/faprotax_plot.R
📦 What’s Included in the Day 4 GitHub Folder ✔ installation_and_run.md
Step-by-step installation + execution for:
● PICRUSt2
● Tax4Fun2
● FAPROTAX
✔ picrust2_plot.R
ggplot visualizations for KO and pathway output
✔ tax4fun_plot.R
Visualization of pathways + redundancy
✔ faprotax_plot.R
Visualization of ecological functions
If you are interested in trying, I’ve included all the required base files in my repository, along with a fully running R script. You can find: feature-table.tsv taxonomy.tsv tree.nwk metadata.txt in day 3 and all codes in day 4 of https://github.com/jojyjohn28/AmpliconWeek_2025
Today’s image features functional predictions I created myself using Microeco.
Thank you to the Campbell Lab’s graduate student seminar series — especially Dinu and Nichole — for the presentation on Microeco