Exploring the Pan-Genome with panX: A Practical Workflow for DARPA Isolates
🧬 Exploring the Pan-Genome with panX
Today’s post walks through the complete setup and execution of panX, a powerful tool for analyzing bacterial pan-genomes.
One of my Master’s students is working on a project involving DARPA isolate genomes, focusing on:
- Abiotic stress adaptation
- Niche classification (generalist vs specialist)
- Functional redundancy
As part of the analysis, she selected 20 isolates and classified them using:
- Genome size
- Total gene count
- CAZyme profiles
- Transporters
- Growth on carbon sources
But after carbon utilization assays, we realized there was still a missing piece:
👉 The pangenome perspective
So we turned to panX.
panX (Neher et al., 2016) integrates:
- Ortholog clustering
- Gene presence/absence matrix
- Phylogenetic inference
- Interactive web visualization
I often use Anvi’o, but because of time constraints, panX was the best choice:
✔ Fast
✔ Lightweight
✔ Clear cluster outputs
✔ Better suited for quick exploratory analysis
⚙️ Step 1 — Cloning and Setup
Clone the official repository:
git clone https://github.com/neherlab/pan-genome-analysis.git
cd pan-genome-analysis
🧱 Step 2 — Install panX Dependencies (Conda)
The documentation suggests Miniconda2, but Miniconda3 works perfectly.
wget https://repo.anaconda.com/miniconda/Miniconda3-latest-Linux-x86_64.sh
bash Miniconda3-latest-Linux-x86_64.sh
source ~/miniconda3/etc/profile.d/conda.sh
Create the panX environment:
conda env create -f panX-environment.yml
conda activate panX
***If you see dependency conflicts: conda env create -f panX-environment.yml –solver=libmamba Test your installation:
sh run-TestSet.sh
🧬 Step 3 — Preparing Genomes with Prokka
panX requires GenBank (.gbk) files. So I annotated all genomes using Prokka. Install Prokka:
conda create -n prokka_env -c bioconda -c conda-forge prokka
conda activate prokka_env
Batch annotation:
for f in *.fa; do
  base=$(basename "$f" .fa)
  prokka "$f" \
    --outdir ../prokka_out/${base} \
    --prefix ${base} \
    --cpus 8 \
    --force \
    --rnammer off
done
Collect all .gbk files:
mkdir -p ../panx_input
find ../prokka_out -name "*.gbk" -exec cp {} ../panx_input/ \;
🚀 Step 4 — Running panX
Move into the panX project directory:
cd ~/pan-genome-analysis/projects
mkdir DARPA_20
cp /project/bcampb7/camplab/Alisha/pangenome_analysis/panx_input/*.gbk DARPA_20/
cd DARPA_20
Run the full pipeline:
python ../../scripts/run-pipeline.py \
    -fn . \
    -sl all \
    -st 13456 \
    --threads 32 \
    --diamond
You will get output folders like: ● 1_parsed_input/ ● 2_clusters/ ● 3_alignments/ ● 4_trees/ ● 5_statistics/ ● summary/
🌐 Step 5 — Interactive Visualization (Optional)
panX includes a full browser-based viewer using Node.js. Clone visualization module:
git clone https://github.com/neherlab/pan-genome-visualization
cd pan-genome-visualization
npm install --legacy-peer-deps
git submodule update --init --recursive
Build and launch:
export DATA_ROOT_URL=/dataset/
npm run build
npm start
Open:👉 http://localhost:8000 📂 Linking Your Dataset to the Viewer Edit: public/dataset/all_downloads_table.json { “panX link”: “gbk”, “species name”: “GBK dataset”, “source”: “Local”, “gene cluster json”: “dataset/gbk/geneCluster.json”, “metadata table”: “dataset/gbk/metainfo.tsv”, “strain/species tree”: “dataset/gbk/strain_tree.nwk” } Refresh the page → your dataset appears in the menu.
🧬 Step 6 — Extracting Core and Pan Genes Without Visualization
Often on HPC (like Palmetto) you only need:
● Core gene count ● Pan gene count ● Accessory genes per genome ● PanX provides allclusters_final.tsv which we can parse directly.
👉 Here is the Python script:
#!/usr/bin/env python3
import pandas as pd
from collections import Counter

infile = "allclusters_final.tsv"
outfile = "core_pan_gene_counts_per_genome.tsv"

clusters = []
with open(infile) as f:
    for line in f:
        genes = [x.strip() for x in line.strip().split("\t") if x.strip()]
        clusters.append(genes)

def genome_name(g): return g.split("|")[0]

cluster_genomes = [list(set(genome_name(g) for g in cl)) for cl in clusters]
all_genomes = sorted({g for cl in cluster_genomes for g in cl})

core_clusters = [cl for cl in cluster_genomes if len(cl) == len(all_genomes)]
genome_counter = Counter(g for cl in cluster_genomes for g in cl)

summary = pd.DataFrame({
    "Genome": all_genomes,
    "Pan_genes": [genome_counter[g] for g in all_genomes],
})
summary["Core_genes"] = len(core_clusters)
summary["Accessory_genes"] = summary["Pan_genes"] - summary["Core_genes"]
summary["Core_fraction(%)"] = (summary["Core_genes"] / summary["Pan_genes"] * 100).round(2)

summary.to_csv(outfile, sep="\t", index=False)
print("✅ Saved:", outfile)
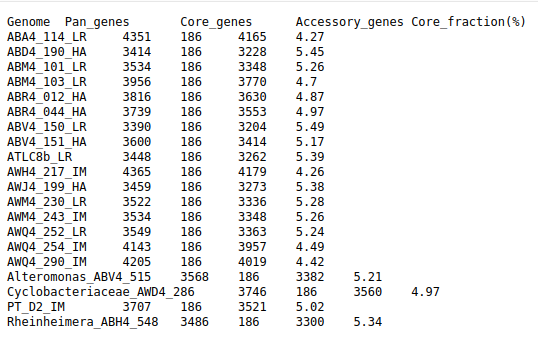
Run with:python core_pan_from_list.py Output file: core_pan_gene_counts_per_genome.tsv Contains:
● Core genes ● Pan genes ● Accessory genes ● Core gene % per genome
Perfect for downstream comparative genomics.
For more details on PanX visit :https://pangenome.org/